Insight

From network-wide symptom to subscriber-level evidence

See RTT, retransmits, capacity, topology, and ASN behavior across one or many shapers, then drill into the exact site, node, circuit, or subscriber causing the issue.

Insight multi-shaper dashboard view

See every shaper from one place

Track throughput, RTT, retransmits, and shaper health across one or many nodes without losing the operator workflow.

Support Scenario

A customer calls: 'My internet is slow.'

One search takes support from a subscriber name to the likely cause — through plan, live circuit health, and the network path above it — without opening a terminal.

Jane Smith

Search: last 15 minutes
Plan
500 / 100 Mbps
Current RTT
21 ms
Retransmissions
0.2%
Circuit congestion
None

Network path

JaneSubscriber circuit
North AP 397% utilization
North Tower64% utilization
10G Backhaul41% utilization

Illustrative workflow using Insight subscriber search, path context, and utilization history.

Likely cause

North AP 3 is capacity constrained.

42 additional subscribers affected.

Insight flags the constrained branch so capacity work targets the right node first.

What Operators Can See

Start with the views that matter in production

Insight is strongest when operators can see network-wide symptoms, isolate the bad site quickly, and drill into the exact circuit or subscriber with supporting context.

Network-wide RTT, retransmits, throughput, and CAKE activity
Site rankings and heatmaps across APs, OLTs, and sites
Tree history and node-level investigation context
Circuit and subscriber drill-down with ASN visibility
Reports and alerts for faster operator triage

Walkthrough

See how Insight moves from symptom to evidence

Follow the operator workflow: see the network, rank the trouble spot, validate the pattern over time, and drill into the exact circuit with supporting evidence.

Step 01

See every shaper from one operational view

Start at the executive dashboard to compare shaper nodes, spot outliers, and understand RTT, retransmits, throughput, CPU, and CAKE activity without pivoting between boxes.

Traffic, RTT, retransmits, and CAKE activity in one view
Shaper-node selection for multi-box environments
Spot quickly which part of the network is behaving differently
Insight multi-shaper dashboard view

Step 02

Rank the trouble spot before support volume spikes

Heatmaps and rankings show a large network at a glance, so teams find the busy AP, OLT, or site without paging through charts.

Heatmaps for RTT, retransmits, capacity, and QoO
Site rankings across APs, OLTs, and sites
A faster path from broad symptom to exact trouble point
Insight site rankings view

Step 03

Validate the pattern over time and isolate the circuit

Once the bad site or node is clear, Insight keeps the timeline intact so operators can verify when performance changed, correlate queue pressure, and narrow the issue to the right circuit.

Timeline context for throughput, RTT, retransmits, and utilization
Node and circuit views without losing the surrounding history
Better evidence before touching the network or replying to support
Insight timeline view

Step 04

Turn a circuit symptom into actionable evidence

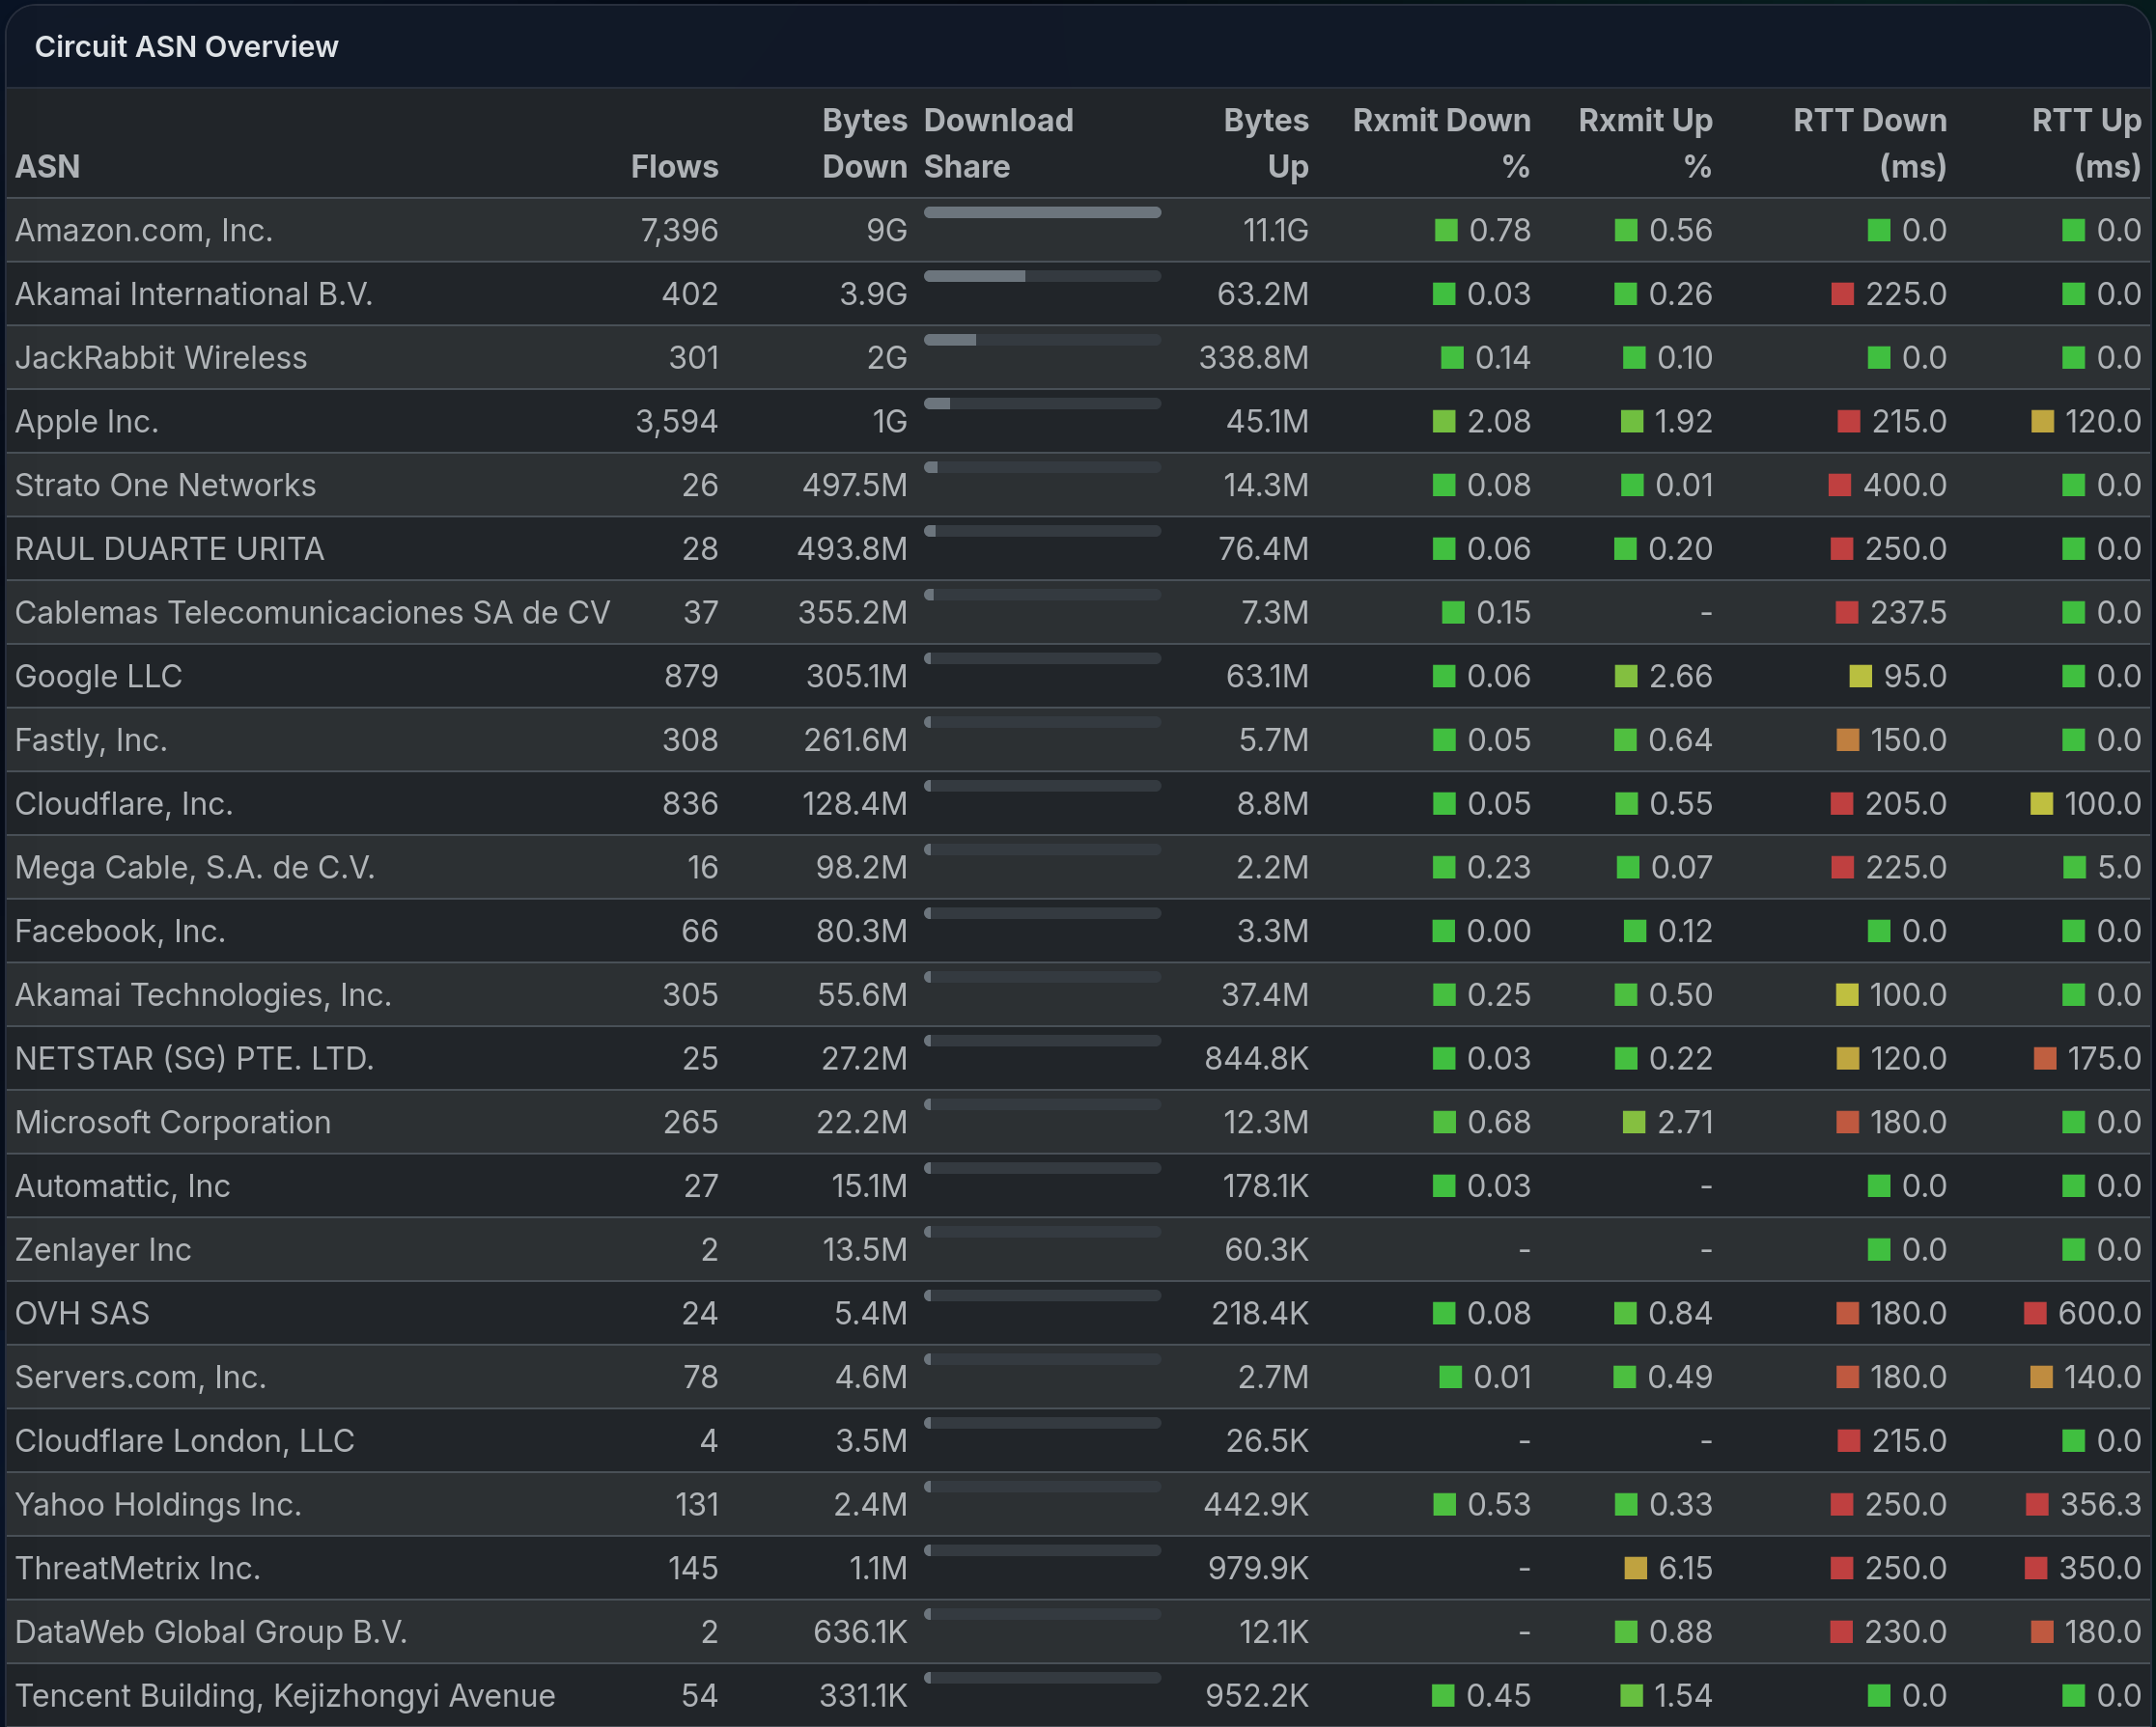
Drill into the exact circuit or subscriber and bring ASN, topology, and behavioral context together so the next action is based on evidence instead of guesswork.

Circuit and subscriber investigation with ASN context
Topology-aware drill-down instead of isolated KPI charts
Clearer input for reports, remediation, or customer follow-up
Insight circuit ASN overview

Operational Signals

Keep the signal history compact and visible

Use compact heatmap strips to spot where latency, retransmits, and outcome quality start drifting before you open a deeper investigation.

RTT

Keep latency patterns visible over time

See which busy-hour windows push latency up — before subscribers start calling.

15-minute blocks

latest hour(s) at a glance

goodwatchbad

Retransmits

See error density without opening charts

Highlight where retransmits start clustering so operators can separate local RF or access issues from broader congestion.

15-minute blocks

latest hour(s) at a glance

goodwatchbad

QoO

Keep outcome quality in the same visual language

The same signals in one compact quality strip.

15-minute blocks

latest hour(s) at a glance

goodwatchbad

Outside-Network Evidence

Bring ASN and internet context into the operator workflow

Insight is strongest when operators can tie network symptoms to destination, ASN, and timeline context before they escalate or touch the network.

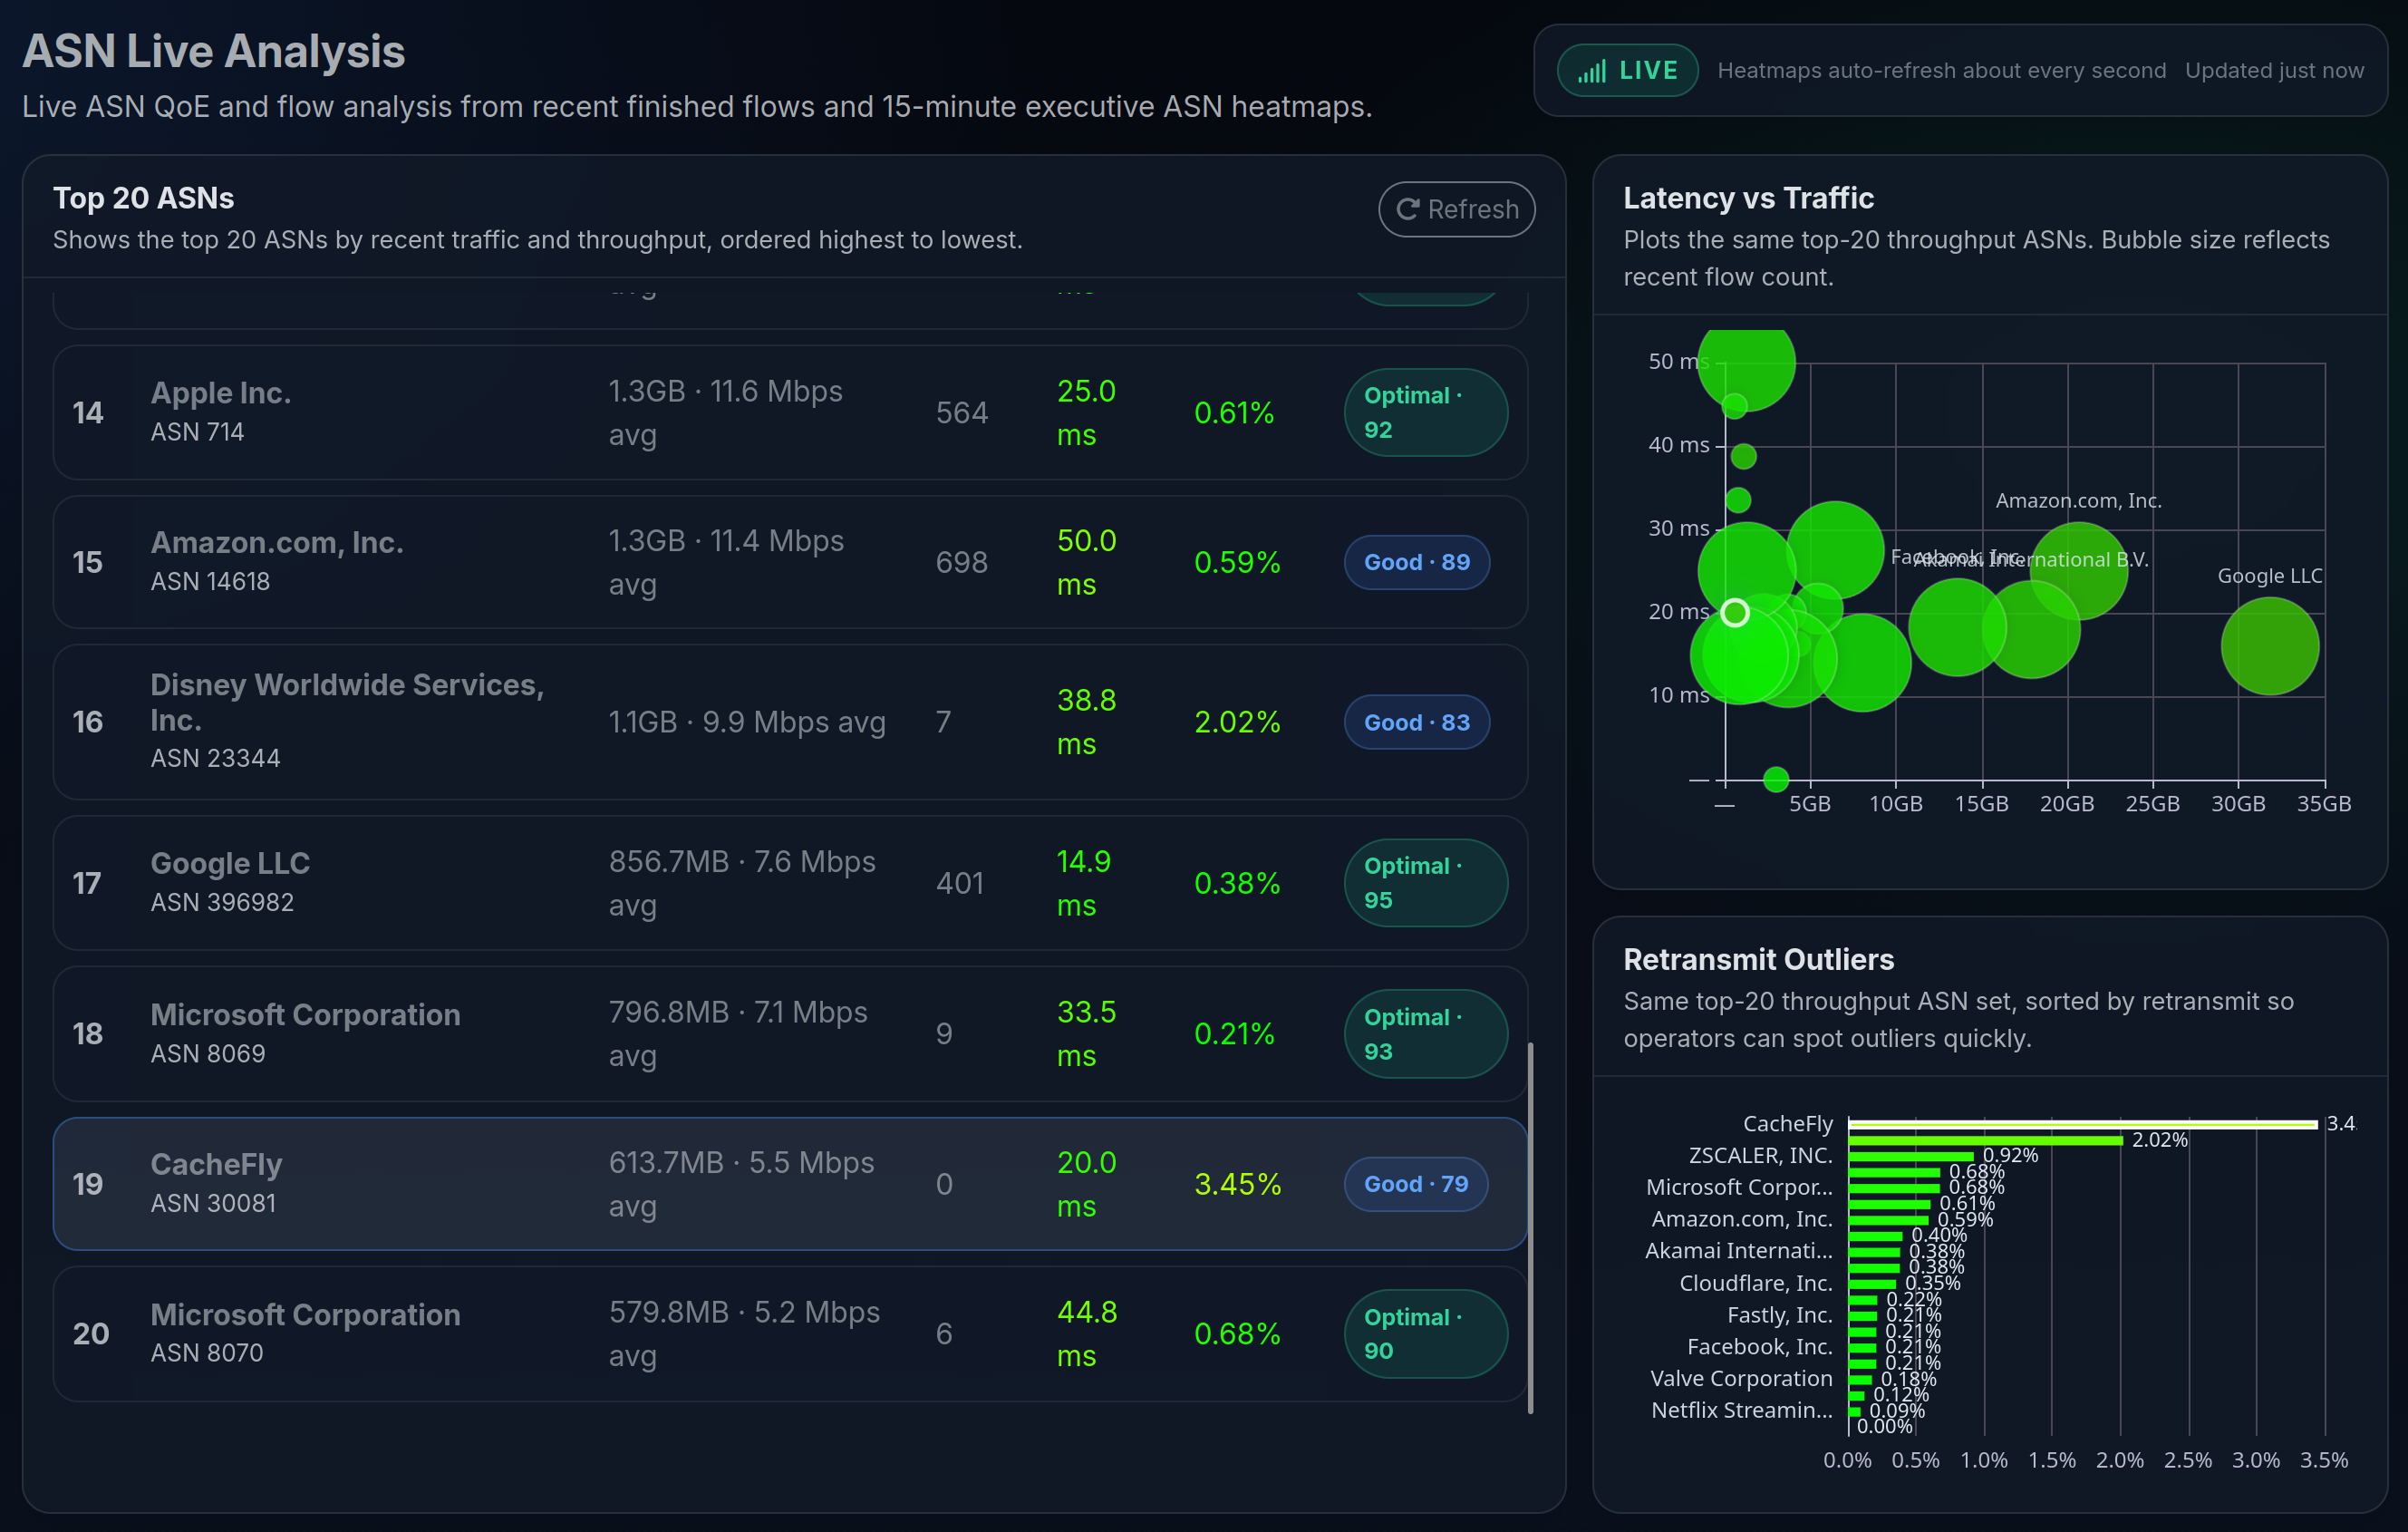
LibreQoS ASN analysis view

ASN Analysis

Correlate latency with traffic by ASN

Spot which upstream networks coincide with high traffic, high latency, or rising retransmits.

Insight circuit ASN overview

Circuit Context

Carry ASN evidence into subscriber investigation

Bring outside-network context into the circuit or subscriber view instead of a separate analytics tool.

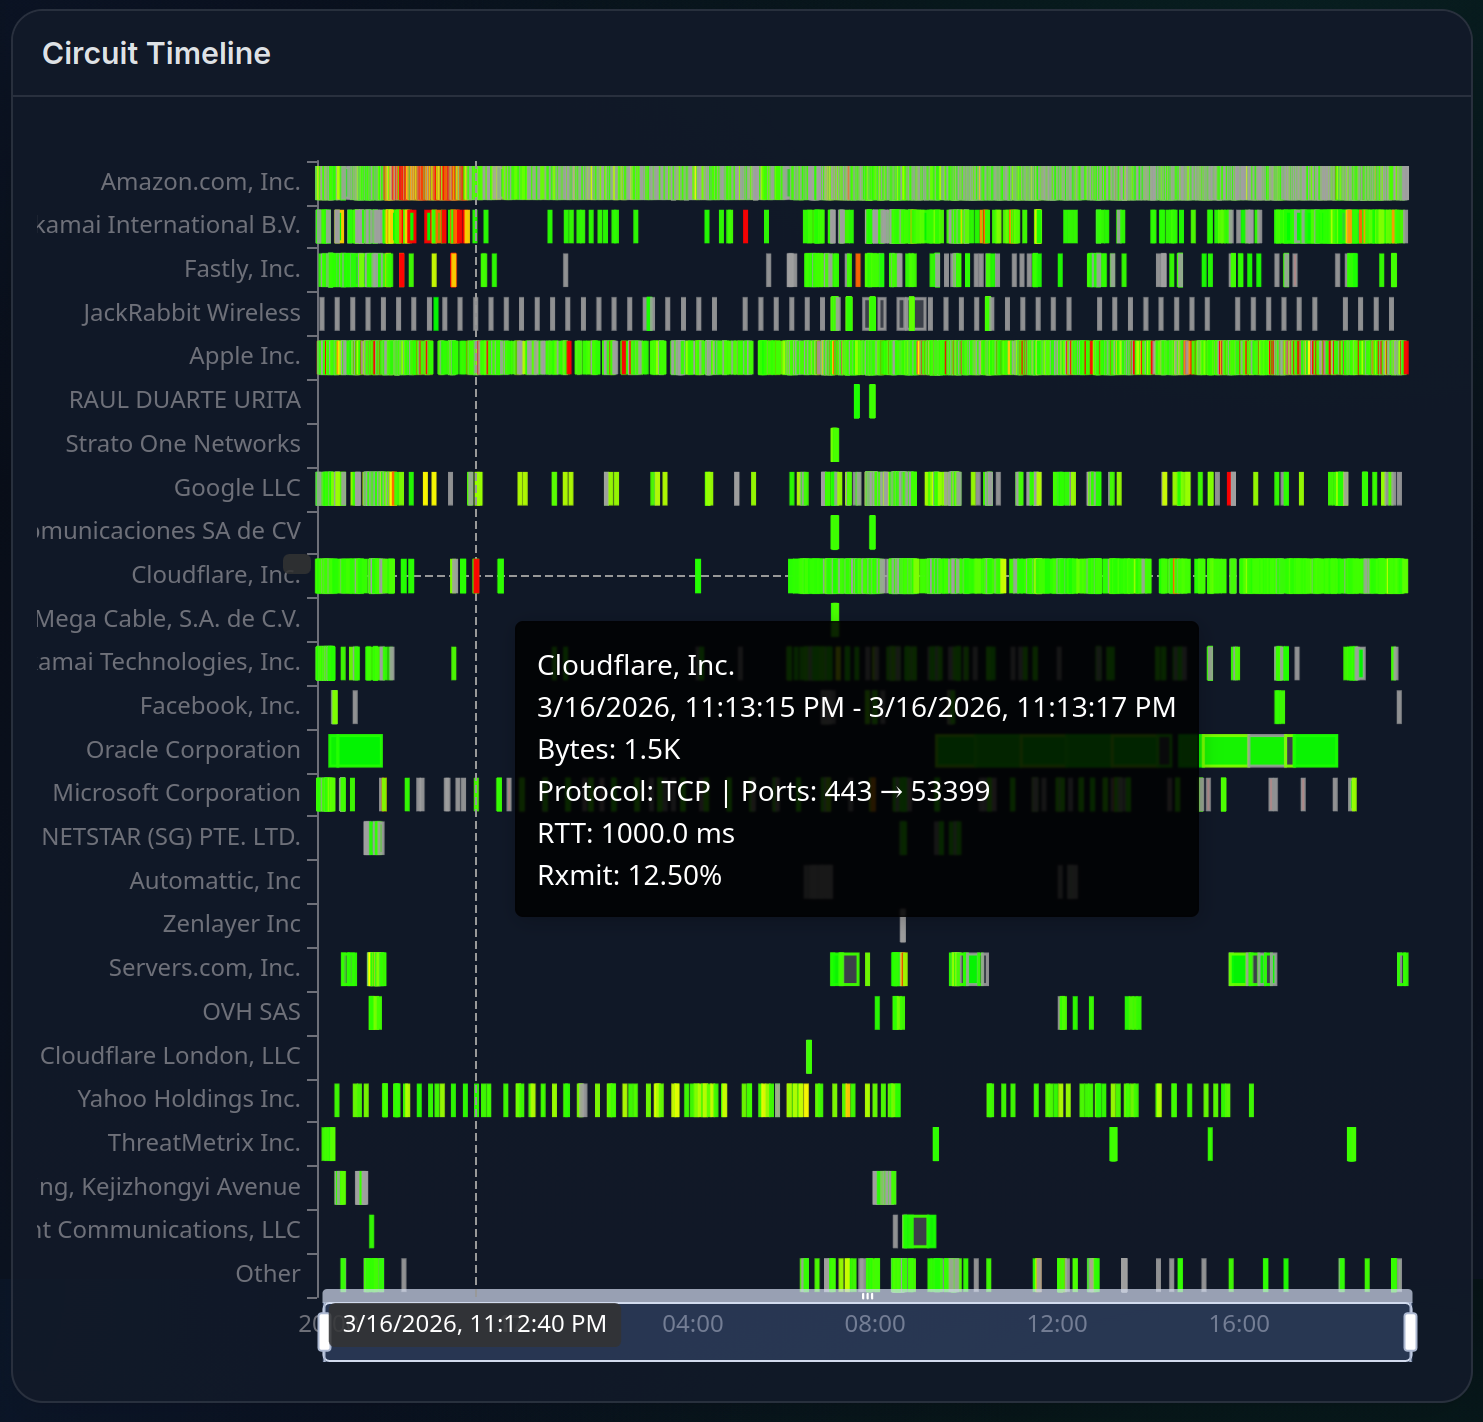
Insight timeline analysis view

Time Context

Keep the timeline while you investigate

Pin down when the pattern changed — before you change configs, escalate upstream, or answer the ticket.

Proof

Why operators use Insight in production

Insight helps teams spot trouble earlier, compare one or many shapers, and keep useful history and alerts in the same place.

15m-1y

time windows for network analysis

Multi-shaper

centralized view across one or many nodes

AI reports

subscriber-focused summaries with topology context

Alerts

Alerts when a node performs outside its normal range

Deploy

Deploy LibreQoS on your own hardware

When you are ready, deploy LibreQoS on your own hardware or talk through the rollout with us.